The following study was strongly influenced by Warren Buffet's approach to value investing.
Note: The study below and the data beneath the charts was mostly compiled in 2003 and published in 2004 with the exception of tweaks made mostly in mid 2008. Serious additions in methodology are accompanied with the notation 'edit' (followed by the date of edit). Minor tweaks (typos, grammar, etc.) have no notation. This page remains the best of my understanding in regard to long-term value investing as of the last edit dates (currently June 2008). The charts are 'live' and therefore always remain current.
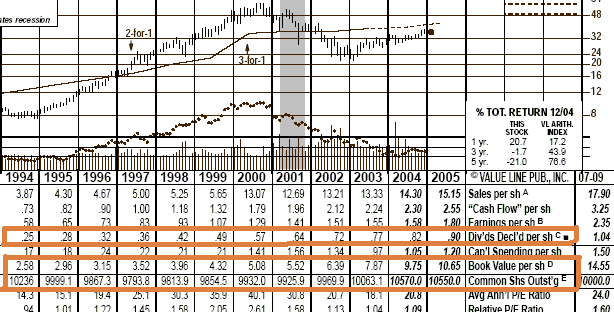
Numerous sources suggest Buffet has been known to study the data from 'Value Line' (in particular sheets that look like this). Value line is the only source, that I am aware of, with the detailed data needed for the study below. If the 'Value Line' subscription is not affordable than I highly recommend taking a look at your local library. The Dow 30 is available for free online.
Listed below are the fastest steady growing large & mid cap stocks I could find based on 'book-value per share' and dividend growth over the last 10 years (edit: mid 2008, Note: this list was compiled in 2003). Most tech & biotech stocks were excluded do to 'dilution' and the difficulty in recognizing a 'durable competitive advantage' (an important Buffet concept). In hindsight I need to include many pharmaceutical companies with key common household products that have endured for decades. The idea is to recognize very solid companies with predictable earnings and then keep checking back for bargain prices. Over 2000 company profiles where studied to compile the list below.
Also included are some companies that bought back there own shares (again something Buffet is big on) and a few 'Warren Buffet' holdings that would not have made the list on book value growth alone. 'Book-value per-share growth' was chosen over 'earnings-per-share growth' because earnings are often subject to one time charges and other sneaky accounting tricks. It is much harder, in my opinion, to fake book value growth over a ten year period. My feeling is that growth of book value, plus dividends, (but not including money raised selling shares) is the best indicator of a companies long term performance. If the company sold many shares over the duration, it is difficult to interpret company profits.
Companies that excelled in the past may have a 'durable competitive advantage' that propels them into the future.
-
If a company was truly profitable then they should have one or more of the following to show for it (without having to dilute their shares):
- more assets (represented in book value).
- paid those profits to there shareholders in the form of dividends.
- purchased back there own shares.
-
Notation for the Study Below:
- B.V.G stands for ‘Book Value Growth’. This is the rate at which a company’s "book value per share" grew over a 10 year period and is represented as a multiple.
- Sh. Ratio (10-Year Share Ratio) is the current total shares outstanding compared to 10 years ago. 10-Year Share Ratio is represented as a multiple (lower is better). If the number is less than one this means the company actually bought their own shares back (this is good).
Some of these companies grew fast by running great businesses. Others grew fast by creating and selling new shares. (Diluting there stock) Warning: Both may be contained below. Just remember, lower is better.
Edit (mid 2008): An important exception is that a company can simultaneously dilute their shares through employee-stock options while simultaneously buying back shares; this can make the 10-year Share Ratio figure fairly meaningless. This aspect requires further research for each stock. For share owners, employee-stock options are generally bad (I know this may be refuted by some, you may research Warren Buffet’s opinion on stock options and then decide for yourself). (/edit)
Some of these companies grew fast by running great businesses. Others grew fast by creating and selling new shares. (Diluting there stock) Warning: Both may be contained below. Just remember, a lower ratio is better, (edit mid 2008) but most likely will not include all option expenses. (/edit mid 2008) - Dividend information is in the left column, middle row (it has no heading due to limited space). The methodology used to determine the size of the dividend was to compare the dividend to earnings, not to stock price. It represents a ratio of company earnings given back to share holders in the form of dividends. It does not represent “yield” in the traditional sense which would be a factor of stock price. This box sometimes includes notation: Sm=Small, Tny=Tiny, etc. The company had to pay dividends for the majority of the last 10 years to receive the notation. (Apologies for this ambiguous/sloppy notation)
- Avg. PE is the median pe ratio for the last 10 years. This is very important; the other steps should help you identify truly excellent companies, but that does not mean you should pay any price for them. The purpose of this valuation is to wait several years if necessary until the company (i.e. stock) becomes cheap compared to historic valuations. Patience is the key, and also identifying multiple companies.
- Other important factors to consider: The stocks listed below simply represent a ‘scan’ of stocks meeting a certain criteria discussed above. There are sure to be good and bad companies listed. Here are some other important criteria that should be considered:
1) Recognizing a "durable competitive advantage": Just to start us thinking, will your 'great grand kids' most likely be drinking Coca-Cola? Will Hershey Bars, Wrigley's Gum, and Budweiser still be around? Get the idea? Any company can make a soda, but if you want a Coke there's only one 'real thing'. Other companies obtain a 'durable competitive advantage' by being the largest in the industry, and dominating the competition. A good example may be Wal-Mart who can out purchase their competition, and therefore undercut their competition in pricing. Which in turn brings more volume, which brings higher volume purchasing etc. etc. Others obtain a durable competitive advantage from having a 'toll bridge' type of position (e.g., the natural-gas pipelines that Berkshire Hathaway has invested in; if an entity needs to move natural gas from point A to point B, there is no competition).
2) edit (mid 2008): Employee Stock Options: I follow Warren Buffet’s lead in regard to stock options and consider this a negative. The degree to which stock options show up in the 10-year Share Ratio will vary greatly from company to company, and therefore requires further diligence for each of the stocks below.
3) edit (mid 2008): This study was done in 2003 and therefore contains 2003 data! For updated data read value line (free at most libraries, the DOW 30 is available free online, or subscription). The information you get in the paper version will not go back this far, just 10 or 15 years depending on the company. For this reason this study remains online as it represents a unique set of data spanning back 10-15 years from 2003.
4) edit (mid 2008): Recession-Proof Companies: After publishing this page in 2003 I have been reminded of Buffet's view in regard to investing in companies that are recession proof (the logic is of course easy for me to see now considering the current sate of the economy). Examples: Consumer staples, discount stores, pharmaceuticals, etc.
The following describes the notation beneath each chart and some additional factors you should consider:-
In Summary:
- Find companies with extremely consistent and great 'quality' earnings for a decade or more.
- It's not enough to recognize great companies. You must buy them cheap in relation to their historical valuations. Think like a bargain hunter.
- Make absolutely sure the company has an identifiable and proven durable competitive advantage and scrutinize the companies stock-option plans (if any). These needs to be weeded out from the list below.
- edit (mid 2008): Find companies that are recession proof.
edit: Value Line data is from 2003.